👥 Teams Guide
The Teams section within the Dashboard provides detailed analytics on team and individual performance. This view helps managers evaluate booking efficiency, cancellations, and overall utilization rates.
📍 Accessing the Teams Dashboard
- On the left sidebar, click the Dashboard icon.
- Click the Teams tab located at the top beside Bookings and Resources.
🧭 Teams Dashboard Components
📊 1. Booking Stats Summary
-
Total Bookings: Total sessions booked across teams this month.
Example:49,984 -
Cancellations: Sessions that were canceled. Example:
7,387 -
Reschedules: Shows rescheduled sessions.
Example:N/Aif data is not available.
📈 All values compare current month performance to the previous month, indicating improvement or decline.
🏆 2. Top Performers
A list of users with the highest utilization percentages.
| Name | Utilization |
|---|---|
| Jane Doe | 96.44% |
| John Smith | 95.44% |
| Alex Green | 94.44% |
| Priya Patel | 93.44% |
| David Lee | 92.44% |
➡️ High utilization = many sessions completed with fewer cancellations or no-shows.
⚠️ 3. Under Performers
This card highlights individuals with lower utilization rates.
| Name | Utilization |
|---|---|
| Sam Taylor | 40.44% |
| Rina Khan | 41.44% |
| Mark Brown | 42.44% |
| Anil Joshi | 43.44% |
| Ella James | 44.44% |
➡️ This is useful for coaching and performance management.
📅 4. Highest This Year
Displays individuals with the top historical performance based on peak utilization.
| Name | Peak Utilization |
|---|---|
| Jane Doe | 98.44% |
| John Smith | 97.44% |
| Alex Green | 96.44% |
| Priya Patel | 95.44% |
| David Lee | 94.44% |
📌 A reference to identify consistent high performers throughout the year.
📄 5. Performance Sheet
This table provides a breakdown of individual metrics:
| Name | Designation | Department | Bookings | Completed | No Show | Utilization |
|---|---|---|---|---|---|---|
| Jane Doe | Tutor | English | 1000 | 950 | 50 | 95% |
| John Smith | Tutor | Math | 1000 | 900 | 100 | 90% |
| Alex Green | Tutor | Science | 1000 | 875 | 125 | 87.5% |
| Priya Patel | Tutor | History | 1000 | 920 | 80 | 92% |
| David Lee | Tutor | Physics | 1000 | 910 | 90 | 91% |
🔍 Filters Available:
- Department Dropdown: Filter results based on selected department.
- Search Box: Type a name to instantly narrow the data table.
🖼️ Reference Image
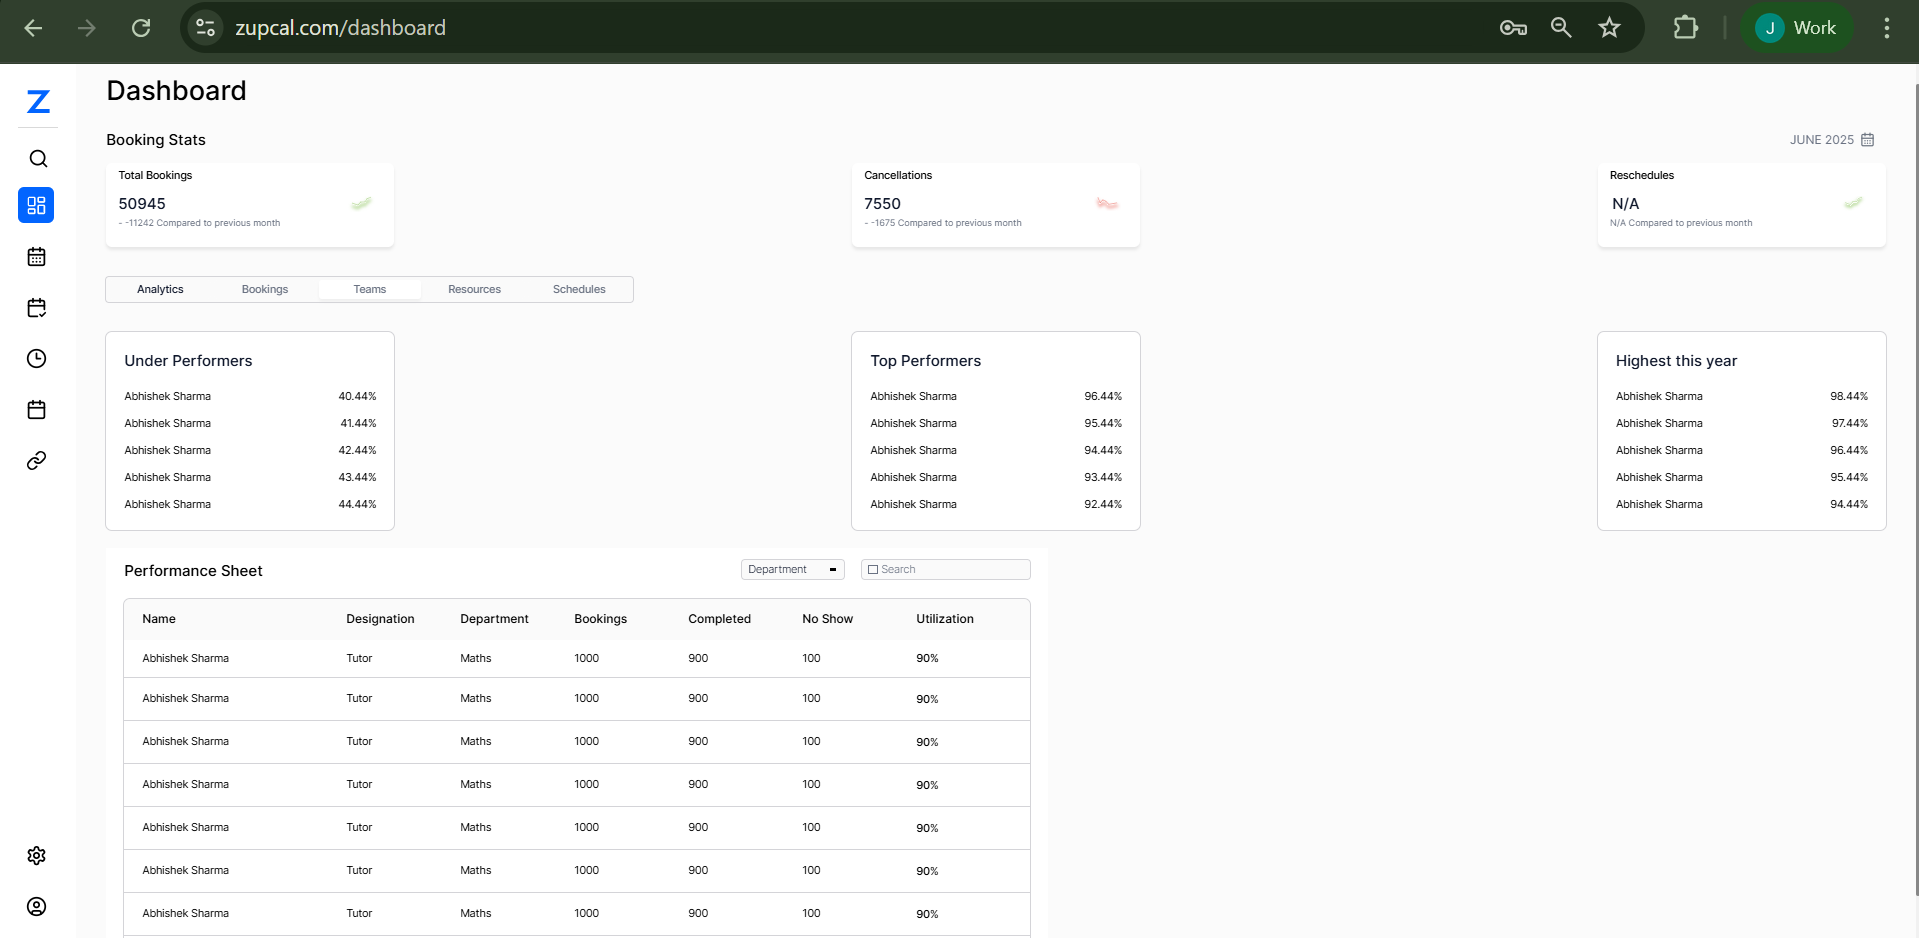
Use this dashboard to manage, evaluate, and improve team-level performance metrics.
🧠 Frequently Asked Questions (FAQ)
1. How is utilization calculated?
(Completed Sessions / Total Bookings) × 100.