📅 Availability Guide
This guide provides a complete walkthrough of the Availability module in the Zupians system. Learn how to view, analyze, and export availability data whether you're a regular user or an administrator.
🧭 Overview
The Availability system offers insights into:
-
Booking utilization
-
Slot statistics
-
User performance metrics
-
Admins can view data for all users.
-
Regular users can only see their own availability.
🧱 Main Interface Components
1. Navigation Panel (Left Sidebar)
- Search
- Dashboard
- Calendar
- Bookings
- Availability (Highlighted in blue)
- Links
- Settings
- Profile
2. Header Section
- Page Title: Availability
- Month/Year Selector:
JUNE 2025(with calendar icon) - Export Button: Blue
EXPORTbutton - Week Navigation: Left/Right arrows with range (e.g. Jun 10 - Jun 16)
3. 📊 Key Metrics Dashboard
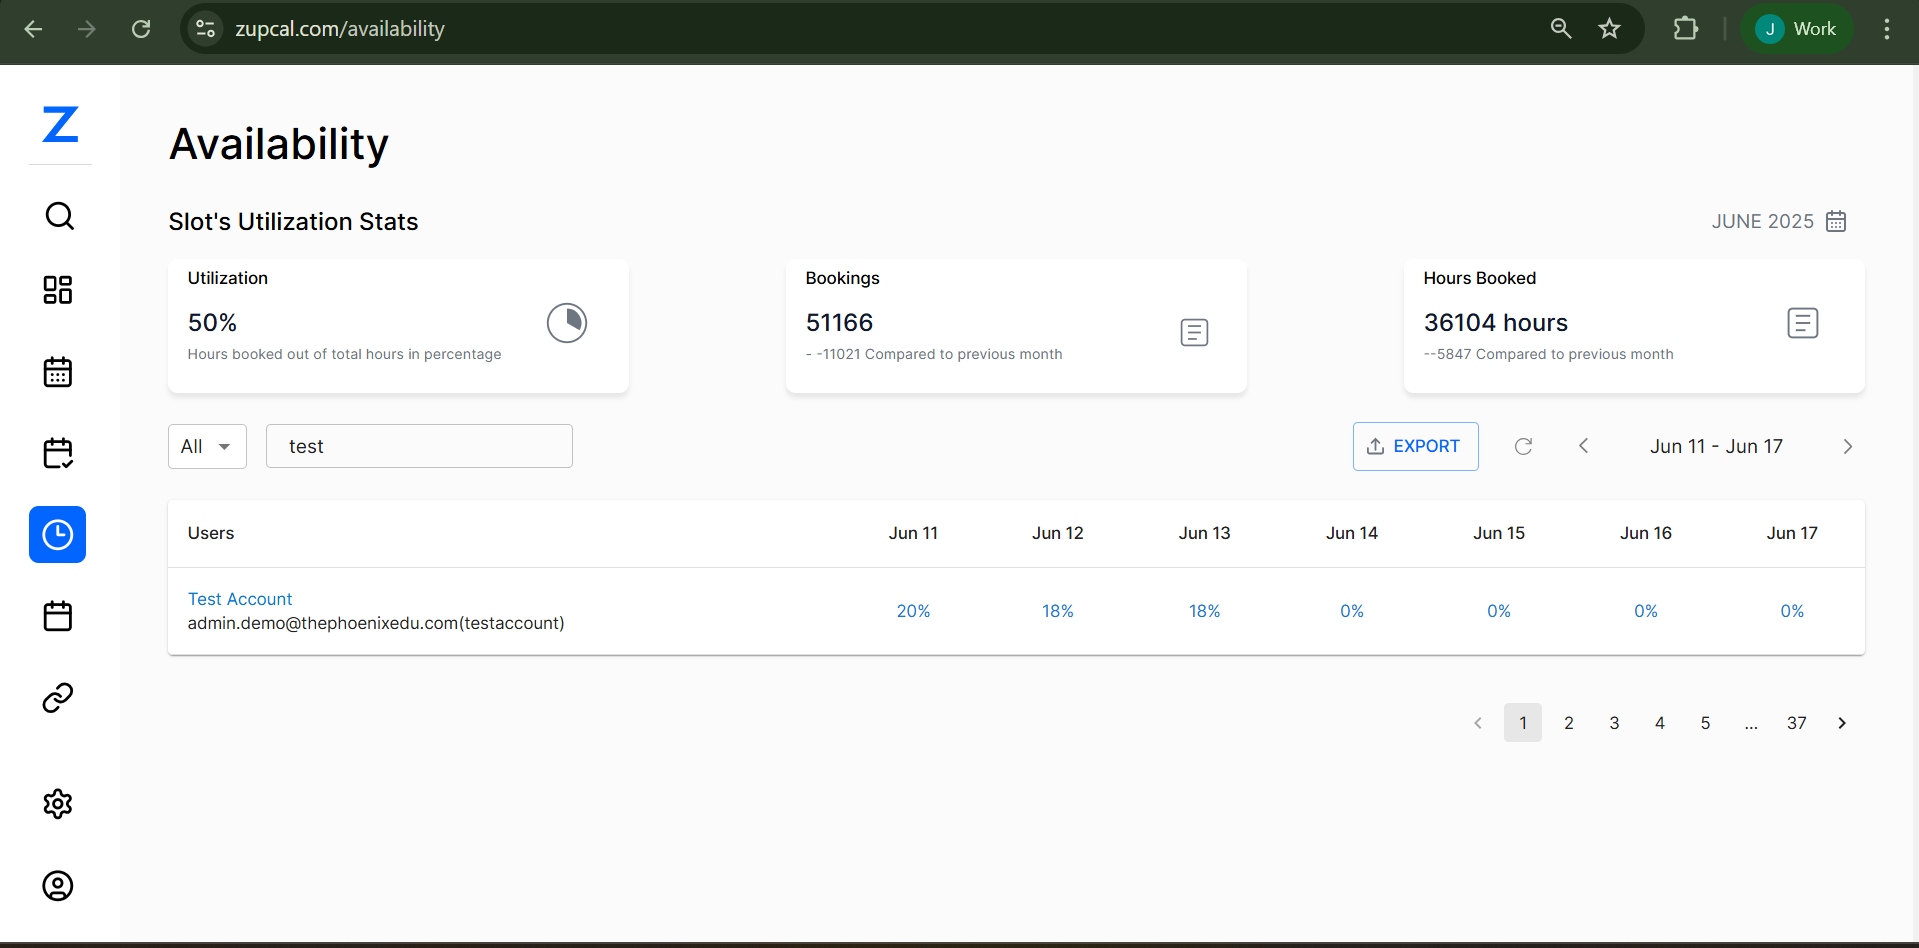
Slot's Utilization Stats
- Utilization:
50%- Percentage of booked vs available time
- Bookings:
50397- Δ -11790 from previous month
- Hours Booked:
35615- Δ -6337 from previous month
📄 User Availability Table
Filter Controls
- User Filter:
Alldropdown - Search Box: e.g.
test - Refresh Button: Circular arrow icon
Table Columns
- Users: Names & emails
- Date Range: Daily % (e.g. Jun 10 to Jun 16)
- Pagination: Page 1, 2, ..., 37
- Row Per Page Options: 5, 10, 25, 50, 100
Sample Row:
- User:
admin.demo@thephoenixedu.com - Daily %:
18%, 16%, 9%, 11%, 0%, 0%, 0%
🔄 Export Options
- Export available in both views:
- Personal (regular user)
- Admin (all users)
- Formats:
.csv,.pdf
👤 Step-by-Step User Flow
For Regular Users
Step 1: View Your Availability
- Login
- Go to
Availability - Your data loads automatically
Step 2: Review Your Metrics
- Utilization %: Shows booking efficiency
- Bookings: Total count, trend vs last month
- Hours Booked: Total time scheduled
Step 3: Analyze Daily View
- Week View (e.g. Jun 10–Jun 16)
- Each day shows % of availability used
Step 4: Time Period Navigation
- Use arrows to switch weeks
- Click "JUNE 2025" to change month
Step 5: Export Data
- Click EXPORT
- Download your data (CSV/PDF)
For Administrators
Step 1: View All Availability
- Login as admin
- Open
Availabilitysection - System-wide metrics displayed
Step 2: Filter by User
- Use
Alldropdown or search box - Select specific users
Step 3: Compare Metrics
- Compare utilization across users
- Identify top/low performers
Step 4: Table Insights
- Paginated user list
- Daily % breakdown for each
Step 5: Export System Data
- Use
EXPORTbutton - Export filtered or complete data
⚙️ Feature Details
| Range | Meaning |
|---|---|
| 0–30% | Low usage |
| 31–60% | Moderate usage |
| 61–80% | High usage |
| 81–100% | Fully utilized |
Booking Trend Insights
- Compare month-over-month changes
- Track seasonal patterns
- Support capacity & performance planning
Daily Availability Guide
| % Range | Status |
|---|---|
| 0% | No bookings |
| 1–25% | Light day |
| 26–50% | Moderate load |
| 51–75% | Busy day |
| 76–100% | Fully booked |
Export Capabilities
- Available in: Both user & admin views
- File Types: CSV, PDF, Excel
- Includes:
- Utilization %
- Bookings
- Hours
- Daily %s
- User/email data
Filtering Features
- Filter by user/email
- Weekly/monthly navigation
- Data refresh on filter change
- Row per page: 5, 10, 25, 50, 100
🔍 Advanced Capabilities
Time Navigation
- Week-by-week arrows
- Month picker
- Custom range (if supported)
Analytics
- Trend comparison
- Underused slot alerts
- Admin dashboards
- Predictive insights
📊 Utilization & Export 🧠 Frequently Asked Questions (FAQ)
Q: What does the utilization percentage represent?
A: It’s the ratio of hours booked vs hours available. For example, 50% means half your slots are filled.
Q: How is the utilization calculated?
A: Formula:
(Booked Hours / Available Hours) × 100 Q: What is a good utilization rate?
A: - 60–80% = Optimal - Below 40% = Underbooked - Above 90% = Overloaded
Q: Why are some days showing 0%?
A: Could be due to a holiday, blocked day, or no available slots.
Q: Can I see other users' availability?
A: Only admins can. Regular users only see their own.
Q: Can I export my data?
A: Yes. Use the blue EXPORT button. Admins can export system-wide data.
Q: What’s in the export file?
A: - Daily percentages - Booking counts - Hours booked - Comparative trends
Q: What formats are supported for export?
A: CSV and PDF. Fully compatible with Excel and Google Sheets.
Q: Why is the export not working?
A: Check for: - Popup blockers - Permissions issues - Try a page refresh - If unresolved, contact tech support
Best Practices
For Users
- Review weekly
- Track your own performance
- Export data regularly
- Adjust your availability based on trends
For Admins
- Monitor full system usage
- Guide underutilized users
- Generate regular reports
- Use trends for resource planning
Data Analysis Tips
- Look for consistent patterns
- Use month-over-month comparisons
- Set org-wide benchmarks
- Act on the insights
This guide gives you full visibility and control over how availability is managed, monitored, and improved across your team or organization.