📊Analytics Guide
The Dashboard provides a real-time snapshot of user activity, event performance, bookings, and cancellations—empowering admins and managers to make informed decisions.
📍 Accessing the Dashboard
- From the sidebar, click the Dashboard icon (📊).
- You’ll be redirected to the Dashboard Analytics page.
📌 Key Dashboard Sections
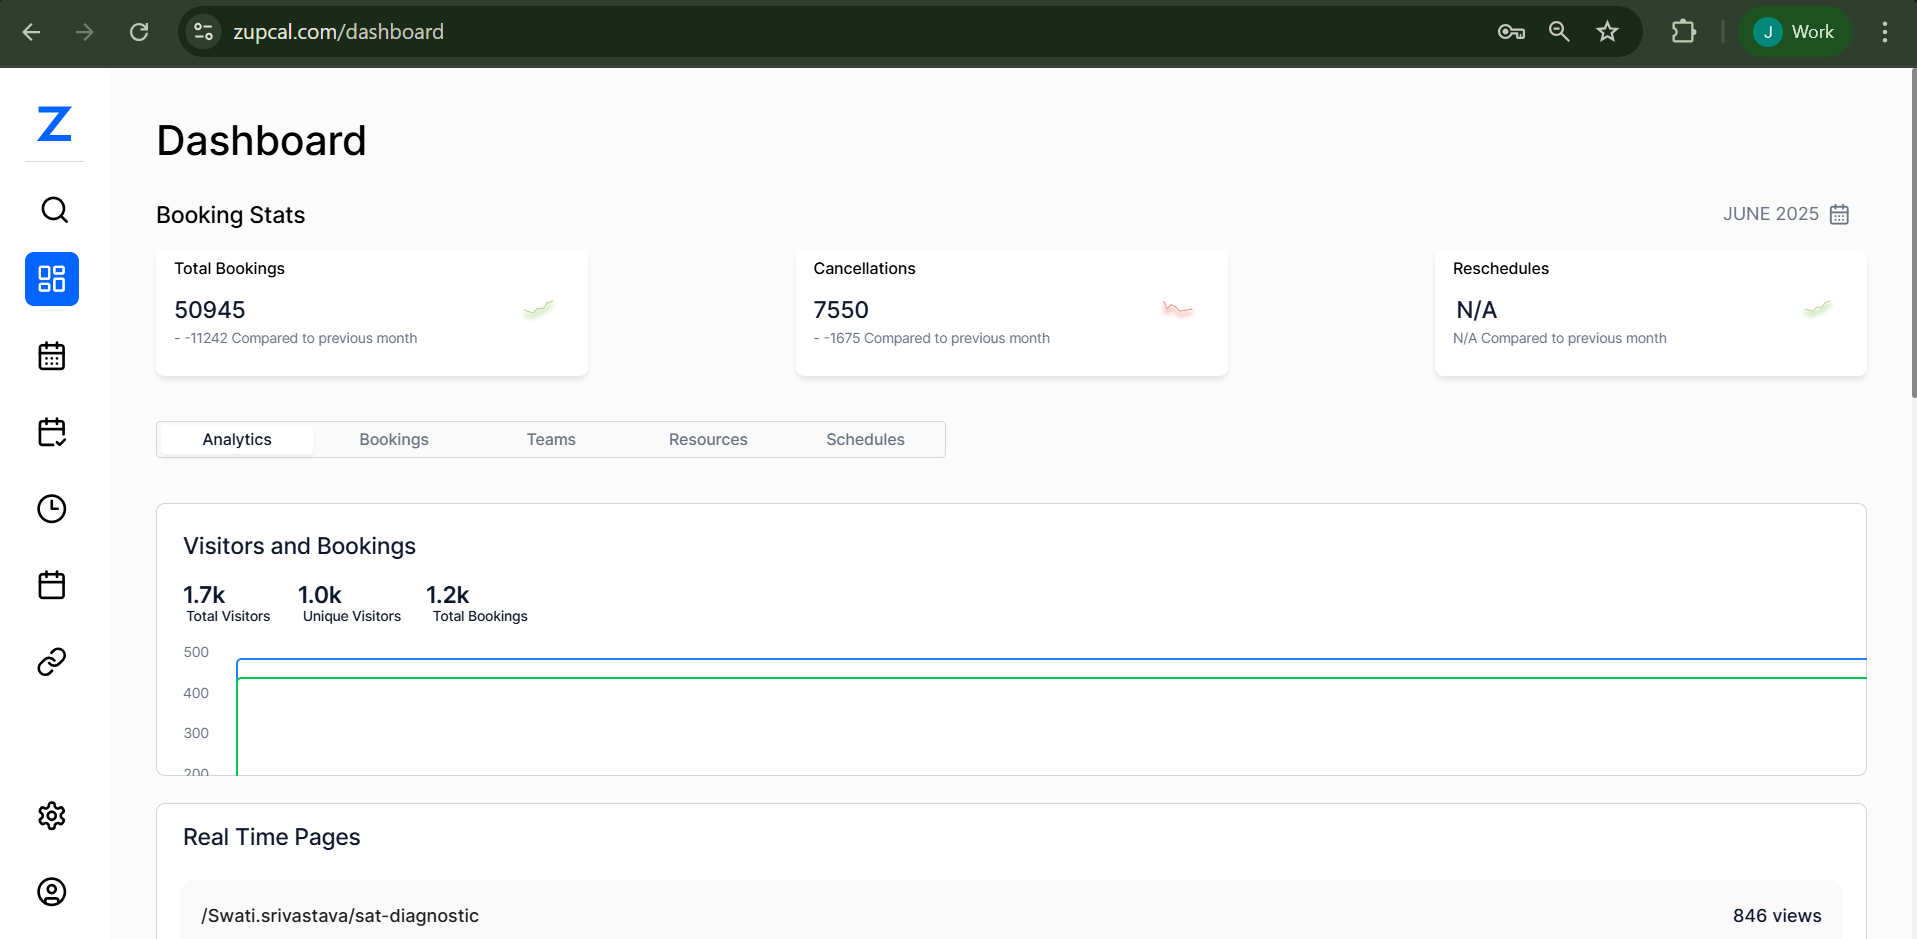
1. Booking Stats Overview
At the top of the dashboard, you’ll see:
| Metric | Description |
|---|---|
| Total Bookings | Total number of bookings made so far (49864 shown in the image). |
| Cancellations | Total cancellations (7387), with comparison to previous months. |
| Reschedules | Tracks how many events were rescheduled (currently showing N/A). |
Each of these metrics provides insights into usage trends and possible areas for intervention.
2. Tabs Navigation Bar
Located just under the stats:
- Analytics: Current tab showing overall data insights.
- Bookings: Deep-dive into all booking records.
- Teams: Usage/activity stats by teams or departments.
- Resources: Check resource utilization.
- Schedules: Overview of upcoming or recurring scheduled sessions.
Clicking any of these will dynamically update the dashboard content.
3. Visitors and Bookings Graph
A visual line graph helps you track:
- Visitors (1.7k)
- Unique Visitors (1.0k)
- Total Bookings (1.2k)
This section makes it easy to correlate user traffic with booking behavior and identify peak activity hours or days.
4. Real-Time Pages View
This list shows all URLs currently being accessed by users, along with view counts:
| URL Path (Example) | Views |
|---|---|
/level/advanced-diagnostic | 908 |
You can track:
- Which sessions are getting the most attention.
- Real-time interest in different training or orientation modules.
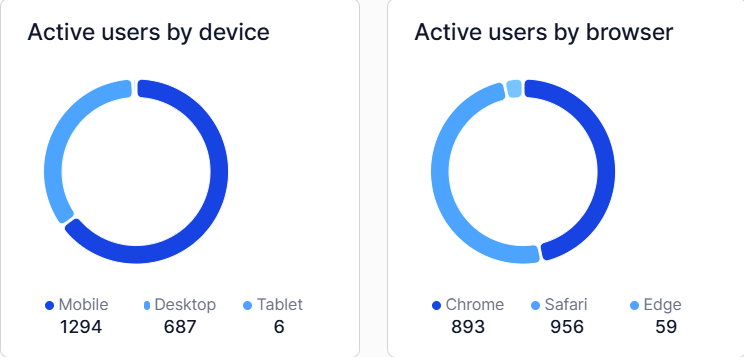
5. User Activity Breakdown
Two donut-style visual graphs provide segmentation:
-
Active Users by Device:
- Desktop, Tablet, and Mobile usage breakdown (e.g., Desktop: 1237 users)
-
Active Users by Browser:
- Chrome, Safari, Edge, Firefox, etc. (e.g., Chrome: 901 users)
This data helps you optimize platform compatibility and design for high-traffic environments.
🖼️ Reference Image
This image displays key analytics widgets, real-time user tracking, and graphical summaries.