📅Bookings Guide
This section of the Dashboard provides a clear breakdown of booking activities by time, geography, and department—empowering you with data to optimize schedules and identify usage patterns.
📍 Accessing the Bookings Dashboard
- On the left navigation sidebar, click the Dashboard icon.
- In the top tab options, select Bookings to explore this view.
🧭 Overview of Booking Dashboard Sections
📌 1. Booking Stats Summary
At the top:
| Metric | Description |
|---|---|
| Total Bookings | Cumulative bookings (49,984 in example). |
| Cancellations | Shows total cancellations (7,387) with a trend comparison. |
| Reschedules | Status on reschedules (e.g., N/A when data is unavailable). |
🛈 These summaries give you a monthly performance snapshot, comparing current values to the previous month.
📊 2. All Bookings Chart
Located on the left under the “Analytics” tab:
- Total Bookings (1.7k): Total appointments booked in the selected date range.
- Unique Bookings (1.0k): Unique users or sessions (not repeated).
📅 Time-based Chart:
- Bar graph shows booking activity per day (e.g., June 11–17).
- Helps identify busy vs. slow days.
🎛 Filter Option:
- Adjust by Time zone to localize your view as per region or user base.
🌍 3. Bookings Across the Globe
This heatmap visualizes geographic booking data.
| Country | Total Bookings |
|---|---|
| India | 20.4K |
| USA | 9.4K |
| Japan | 1.4K |
| Germany | 3.2K |
| Brazil | 5.8K |
| Canada | 7.1K |
🗺️ The map highlights countries with higher booking density in darker shades of blue.
📈 Use this to:
- Understand user base distribution.
- Target region-specific support or expansion.
🔥 4. Time Slot Hotspot
A powerful grid chart below the world map.
🎯 Purpose:
To help identify peak hours across specific dates.
📅 Timeline:
- X-axis = Dates (e.g., June 11–29).
- Y-axis = Hour ranges (e.g., 0–3, 3–6, …, 21–24).
🔘 Visual Cues:
- Circle size = Number of bookings.
- Larger and darker circles indicate heavier activity.
📂 Filters:
- Date Selector: Pick a range like "June 2024".
- Booking Type: Choose “All Bookings” or filter by type.
- Department Dropdown: Narrow down bookings by internal team.
- Search: Manually look up keywords or user details.
🖼️ Reference Image
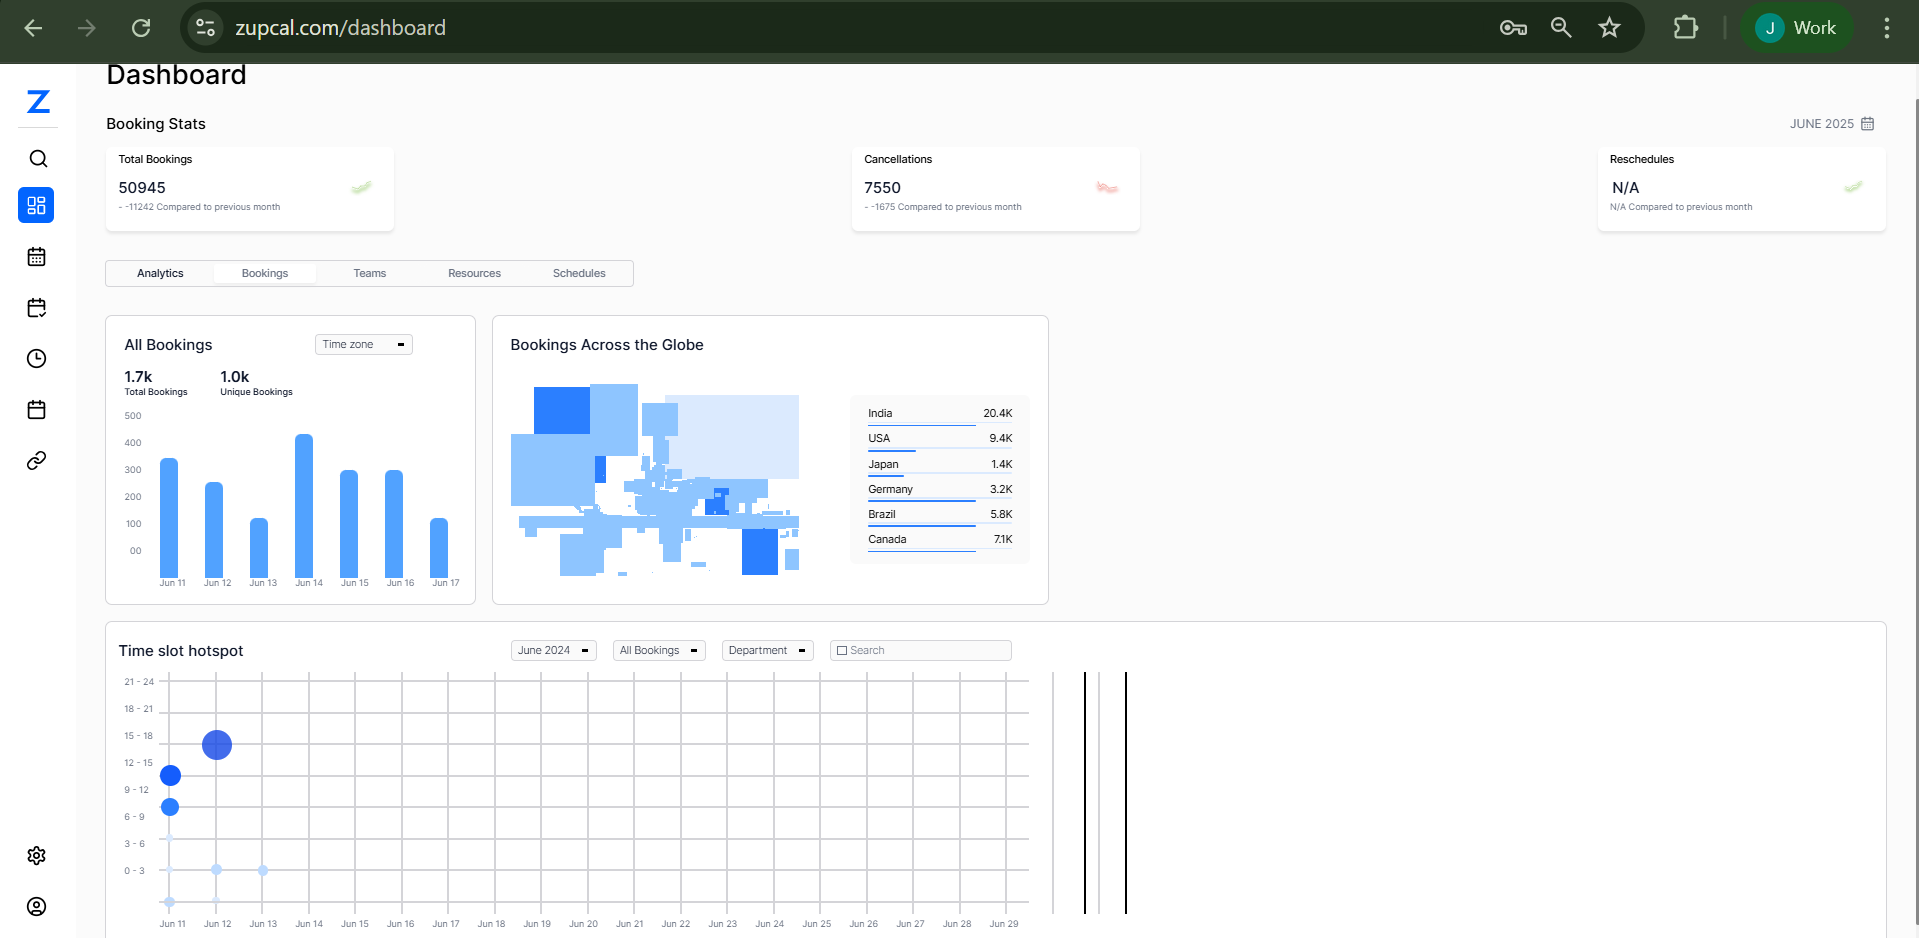
This view highlights booking volume across time, region, and department with intuitive visuals.
🧠 Frequently Asked Questions (FAQ)
1. Can I download booking data from the dashboard?
No, not directly. Use the Bookings module or integrated reporting tools to export data.
2. What defines a unique booking?
A unique booking is made by a distinct user or for a distinct event within the selected timeframe.
3. How often is the data updated?
Booking data is refreshed in near real-time and reflects live traffic within minutes.
4. Can I compare booking patterns by region?
Yes. Use the “Bookings Across the Globe” map to visually assess regional activity.
5. Why are some countries missing from the map?
Countries only appear if bookings exist from those locations during the selected date range.